Monitoring Project Schedule
As the Project progress, activities are started and completed as per the Schedule Baseline. Any delays may have Cost implications or incur Penalties (Liquidated Damages) in accordance with the Contract. Specifically:
- EVA KPIs indicate the Status of Project Schedule-wise. Relevant KPIs are SV tu, SPI tu, SV mu & SPI mu, SV% mu & EAC time. Any SV which is negative, or any SPI which is less than 1 is indicative of the Project behind Schedule. EAC time is the forecast completion time of the Project.
- SV & SPI Trends also indicate forecast completion of the Project Should the Project lag the Schedule, it may be brought back on Schedule by:
- Fast Tracking (FT)
- Crashing
- Do Activities planned in Series, in Parallel, (FT) if they were put in Series to create some Time reserve
- Leads
- Trimming Scope (with the permission of the Customer)
- Lowering Grade (with the permission of Customer)
- Alternative Procurement options for items not-in-stock
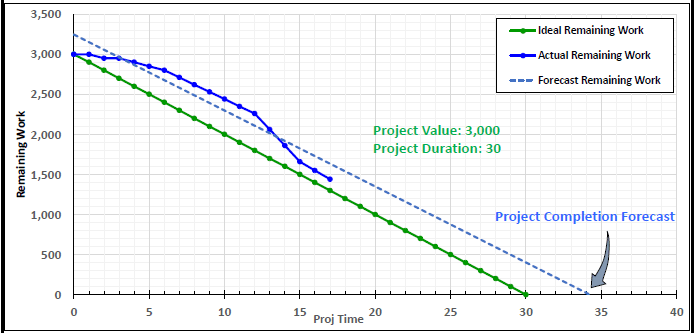
- Schedule can also be monitored through a burndown chart.
Burndown Chart
- Burndown refers to time-based project work remaining, that is it is the Plan. A second line represents the Actual Remaining Work is then plotted.
Monitoring Project Cost
How much Profit does the company make on a Project is directly dependent on how well the Project Finances are managed and controlled, to stay within the Budget (Cost Baseline), as the Project progresses. Specifically:
- Work Performed is measured against the Funds Expended
- Funds Expended are controlled in every possible not to exceed the Authorized Funding for the Activity/Work Package
- If they do exceed, then Cost Overruns are controlled to remain within Acceptable Limits (Contingency Reserves)
- If Overruns exceed even the Acceptable Limits, Change Requests for more funds (Management Reserves) are initiated and processed
Project Overrun Causes
- Changes in Material Costs
- Changes in Resources Costs
- Changes in Schedule
- Incorrect Cost Estimates
- Cost of Quality (Non-Conformance)
- Inadequate Reserves to meet Known & Unknown Risks
- Changes in Duties & Taxes
Variance Analysis
It helps establish deviation in Costs due to Material or Resources Costs
- Plan: 10,000 bags of cement @ Rs 500 → Funds Allocated: Rs 5 M
- Actual: 9,500 bags used @ Rs 600 → Funds Expended = 9,500bagsxRs600 = 5.7M
Cost Overrun= 5 -5.7 = -0.7 M
EVA KPIs
These indicate the Status of Project Cost. Relevant KPIs are CV, CPI, VAC, EAC cost, ETC, & TCPIs. Any CV which is negative, or any CPI which is less than 1 is indicative of the Project over Budget. EAC cost, VAC, ETC and TCPIs are the forecast completion of the Project. CV & CPI Trends also indicate forecast completion of the Project
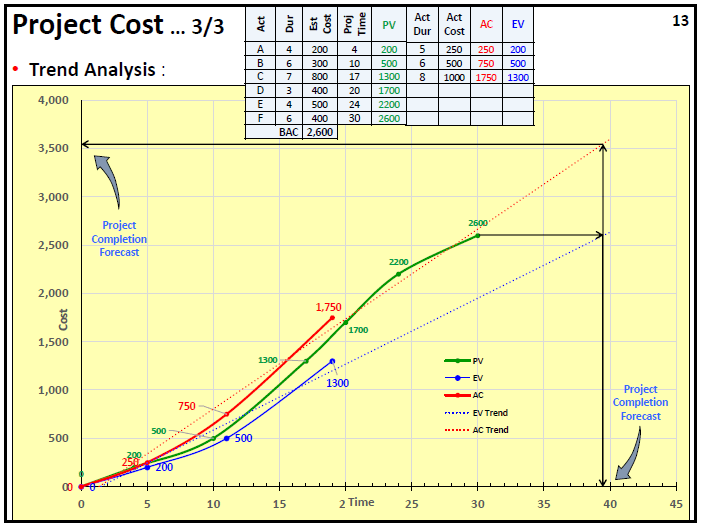
Trend Analysis
Trend analysis helps determine if the Cost performance of the Project is improving or worsening as the Project progresses. During planning, the Cost Baseline was prepared and depicted on the graph as PV. To the same graph, EV and AC are added to indicate over/under spending by comparing EV and AC, and the Trend is observed.


