Scenario:
Khaadi-Kapra manufactures garments that are sold through large retail outlets across the world. Khaadi-Kapra is concerned with how variable the sales are at different stores. They requested and received for sales data of the past 30 weeks on their men’s product line, from five of their retail stores.
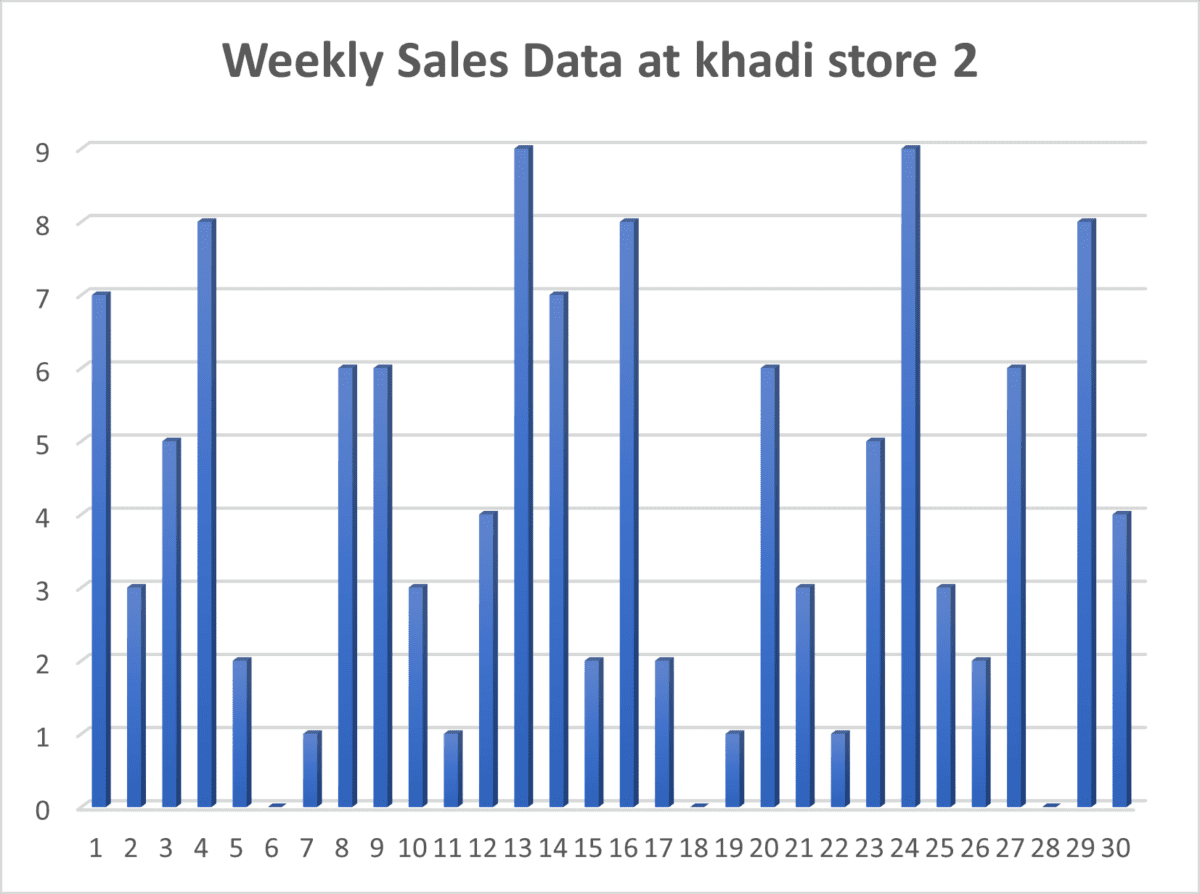
Question: What can we say about the weekly sales in store 2?
Find:
- Graph out the sales for Khaadi-Kapra.
- Create a histogram.
- Find the mean, range, inner quartiles, variance, standard deviation, co-efficient of variation.
30 Weeks Sales Data of Store 2 | |
| Week | Weekly Sales Data at khadi store 2 |
| 1 | 7 |
| 2 | 3 |
| 3 | 5 |
| 4 | 8 |
| 5 | 2 |
| 6 | 0 |
| 7 | 1 |
| 8 | 6 |
| 9 | 6 |
| 10 | 3 |
| 11 | 1 |
| 12 | 4 |
| 13 | 9 |
| 14 | 7 |
| 15 | 2 |
| 16 | 8 |
| 17 | 2 |
| 18 | 0 |
| 19 | 1 |
| 20 | 6 |
| 21 | 3 |
| 22 | 1 |
| 23 | 5 |
| 24 | 9 |
| 25 | 3 |
| 26 | 2 |
| 27 | 6 |
| 28 | 0 |
| 29 | 8 |
| 30 | 4 |
- Graph out the sales for Khaadi-Kapra.
Khadi Kapra sales – Graphing it Out
Sorted Weekly Sales Data (smallest to largest) | |
| Week | Weekly Sales Data at khadi store 2 |
| 6 | 0 |
| 18 | 0 |
| 28 | 0 |
| 7 | 1 |
| 11 | 1 |
| 19 | 1 |
| 22 | 1 |
| 5 | 2 |
| 15 | 2 |
| 17 | 2 |
| 26 | 2 |
| 2 | 3 |
| 10 | 3 |
| 21 | 3 |
| 25 | 3 |
| 12 | 4 |
| 30 | 4 |
| 3 | 5 |
| 23 | 5 |
| 8 | 6 |
| 9 | 6 |
| 20 | 6 |
| 27 | 6 |
| 1 | 7 |
| 14 | 7 |
| 4 | 8 |
| 16 | 8 |
| 29 | 8 |
| 13 | 9 |
| 24 | 9 |
Khadi Kapra – Distributions
Frequency Table | |||
| Weekly sales (Range limits) | Frequency | Probability | Cumulative % |
| 0 | 3 | 10% | 10.00% |
| 1 | 4 | 13% | 23.33% |
| 2 | 4 | 13% | 36.67% |
| 3 | 4 | 13% | 50.00% |
| 4 | 2 | 7% | 56.67% |
| 5 | 2 | 7% | 63.33% |
| 6 | 4 | 13% | 76.67% |
| 7 | 2 | 7% | 83.33% |
| 8 | 3 | 10% | 93.33% |
| 9 | 2 | 7% | 100.00% |
| Total | 30 | 100% | 100.00% |
2. Create Histogram – Khadi kapra
Cumulative Distribution of Sales – Khadi
3. Find the mean, range, inner quartiles, variance, standard deviation, co-efficient of variation.
| Statistical Summary | |
| Mean = | 4.066666667 |
| Standard Error = | 0.522886184 |
| Median = | 3.5 |
| Mode = | 3 |
| Standard Deviation = | 2.863965581 |
| Variance = | 8.202298851 |
| Coefficient of variance = | 0.12857857 |
| Range = | 9 |
| Minimum = | 0 |
| Maximum = | 9 |
| Sum = | 122 |
| Count = | 30 |
Khadi – Quartiles Table
| Quartiles | |
| Q1 | 2 |
| Q2 | 3.5 |
| Q3 | 6 |
| Q4 | 9 |


