Project Flow Chart
Flow Charts represent relationships among the Activities and Tasks that make up a project process. Uses:
- Determine COQ
- Study the Steps of a Process leading to a Quality defect
- Make Changes to the Process with a Quality defect
Consider flow diagram for a simple project of painting a house

Control Chart
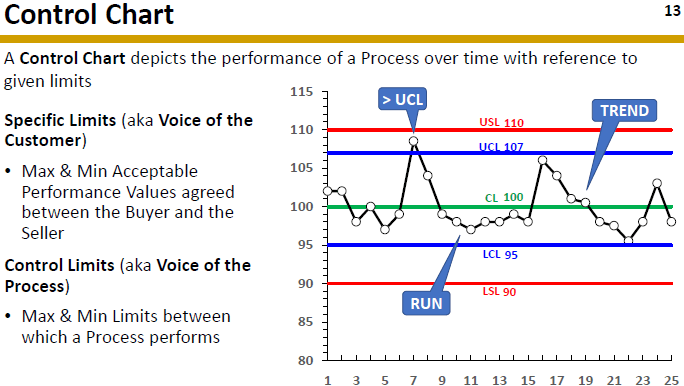
A Control Chart depicts the performance of a Process over time with reference to given limits
Difference between ‘Voice of the Customer’ and ‘Voice of the Process’
‘Voice of the customer’ are basically the specifications given by the customer for the desired deliverable. (According to the need of customer).
Whereas ‘Voice of the process’ are the control limits which are accordingly to the requirement of a process. (according to the need of deliverable).
Specific Limits (aka Voice of the Customer)
- Max & Min Acceptable Performance Values agreed between the Buyer and the Seller
Control Limits (aka Voice of the Process)
- Max & Min Limits between which a Process performs
Process Out of Control when:
- A data point exceeds a control limit
- Seven consecutive plot points are above or below the mean; or
- Seven consecutive points occur in the same direction towards the UCL or LCL
Run Chart
Run chart is simpler form of the control chart. It depicts the performance of a process over time, without showing the limits.
- Primarily used to establish Trends or Patterns
Control limits are the minimum or maximum limits in which a process perform. While specification limits are the minimum/maximum limits which are least required for customer satisfaction.
A Control Chart also depicts the performance of a Process over time, but without regard to Specific or Control Limits
What is a ‘Histogram’?
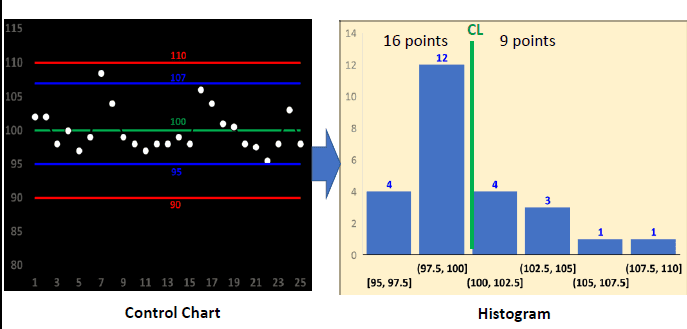
A Histogram is a type of Bar graph which shows how many Data Points (frequency) lie in a Data Range, from Low to High
- Primarily used to establish Trends or Patterns
Histogram tell/show the frequency of all the data points according to the set of “bin”.
Control Chart Vs Histogram Example
Cause & Effect Diagram
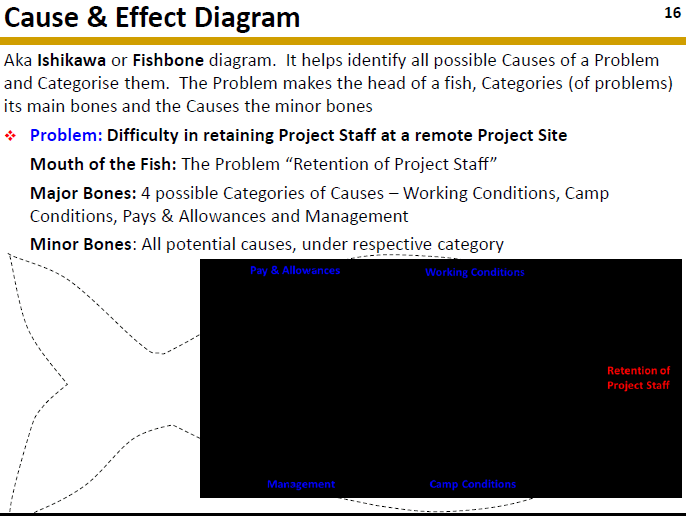
Also known as Ishikawa or Fishbone diagram. It helps identify all possible Causes of a Problem and Categories them. The Problem makes the head of a fish, Categories (of problems) its main bones and the Causes the minor bones
Problem: Difficulty in retaining Project Staff at a remote Project Site
- Mouth of the Fish: The Problem “Retention of Project Staff”
- Major Bones: 4 possible Categories of Causes –Working Conditions, Camp Conditions, Pays & Allowances and Management
- Minor Bones: All potential causes, under respective category
Pareto Diagram
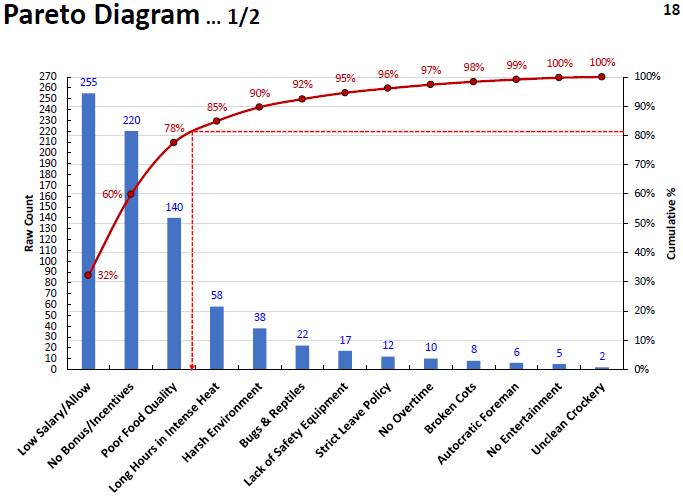
Pareto Principle: A small number of Causes are responsible for many Problems. Also known as 20-80 Rule.
Pareto Diagram. A combination of Bar and Line Chart which depict Causes as follows:
- Bar Chart: Magnitude of Cause (in terms of Frequency Count) in descending order
- Line Chart: Cumulative Frequency in terms of percentage.
Check Lists versus Check Sheets
- Check Lists can be used to confirm that the steps of a Process have all been completed. Lt may also be used to analyze defects discovered in Quality Inspections, looking for issues within the process, and to assess whether a Deliverable meets Acceptance Criteria
- Check Sheets are used to collect data, both Qualitative & Quantitative, in real time at the location where the data is generated. Aka Tally Sheets when the data is quantitative


